Each tab in CRM Reports enables you to generate reports on agent interactions with their contacts within the CRM.
These reports are designed to help Brokers monitor agent activity. Agents will have limited access and can only view their own activity.
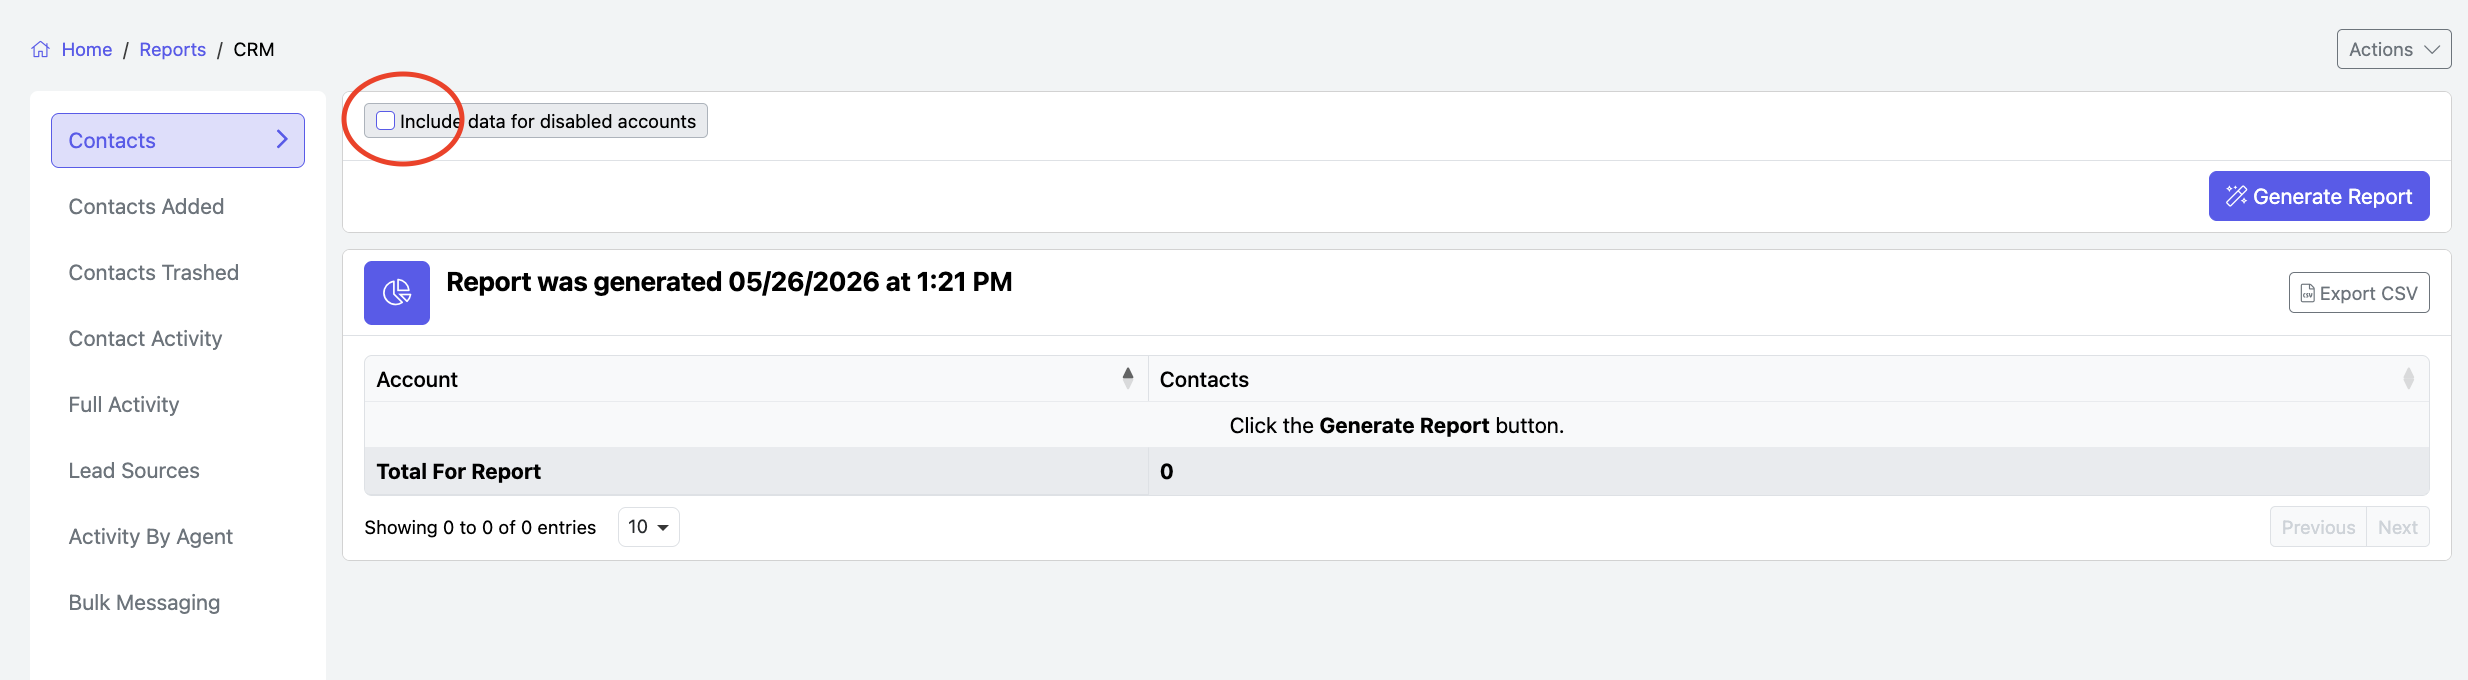
To access CRM Reports, navigate to your dashboard, click "Reports", and then select "CRM".

You may choose to include disabled account’s contacts in the reports by selecting the checkbox.
By default, these contacts are not included in the reports.
CONTACTS
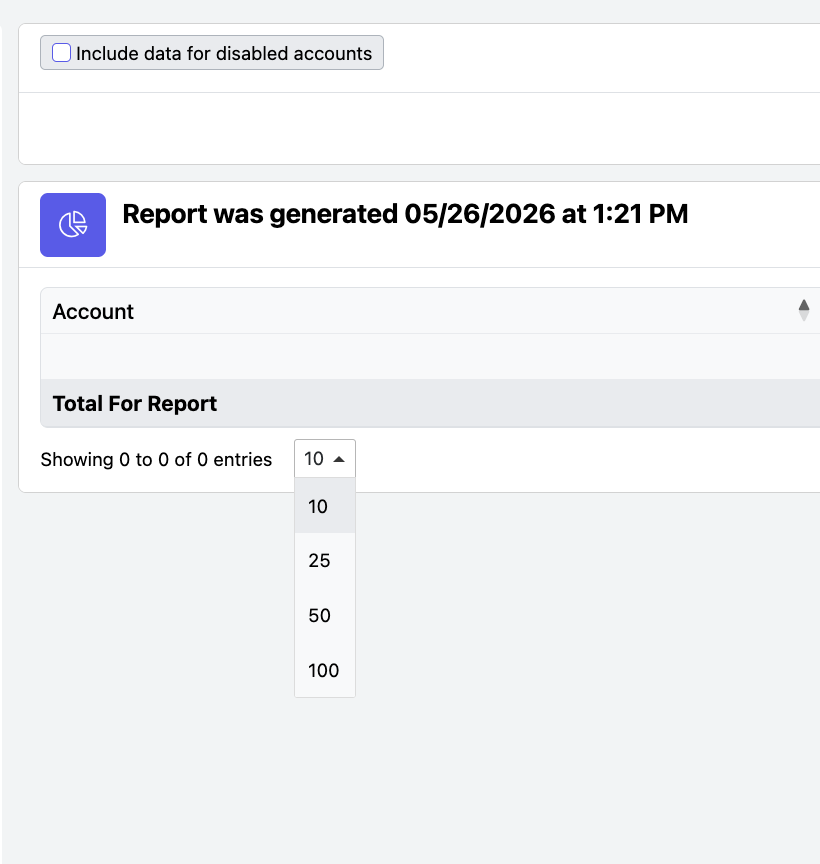
To adjust the number of entries displayed on any tab, use the "Show Entries" dropdown menu.
The total count for the reports will be shown at the bottom of the table.
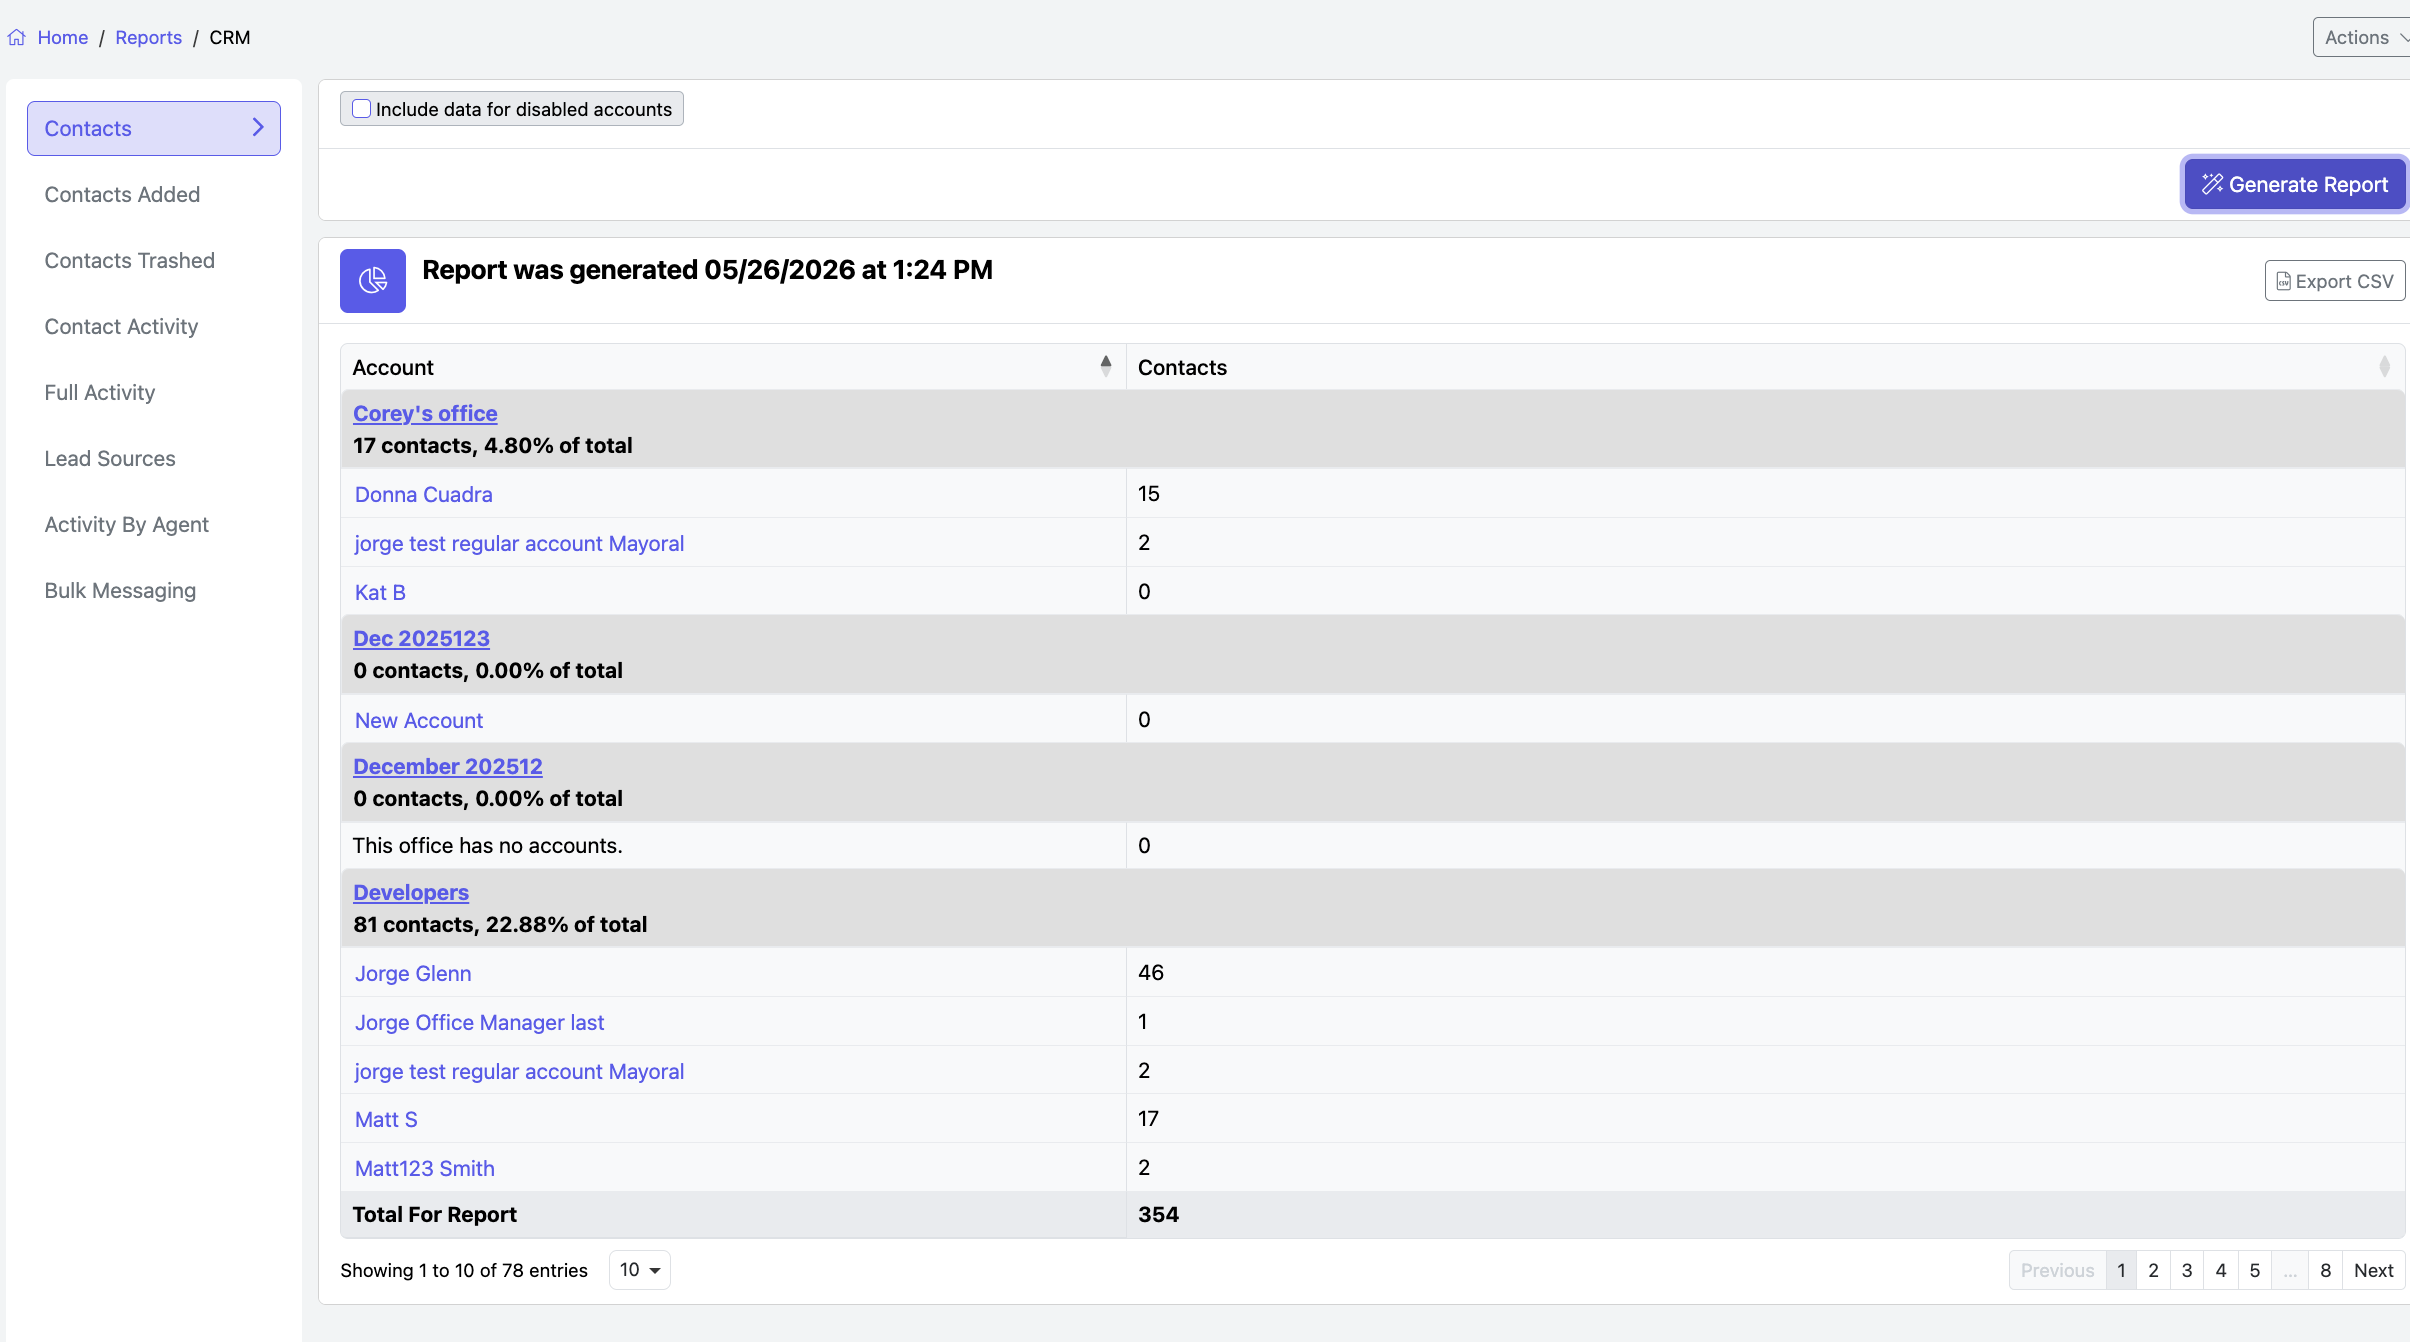
Contacts: This tab displays the total number of contacts each agent has, organized alphabetically by Office. Within each office, agent names (Account) are also listed alphabetically (A-Z or Z-A).
- To change the sorting order, click the down arrow icon next to the Account column.
- To sort by the number of contacts, click the Contacts column, then use the down arrow icon to toggle between ascending and descending order.
CONTACTS ADDED
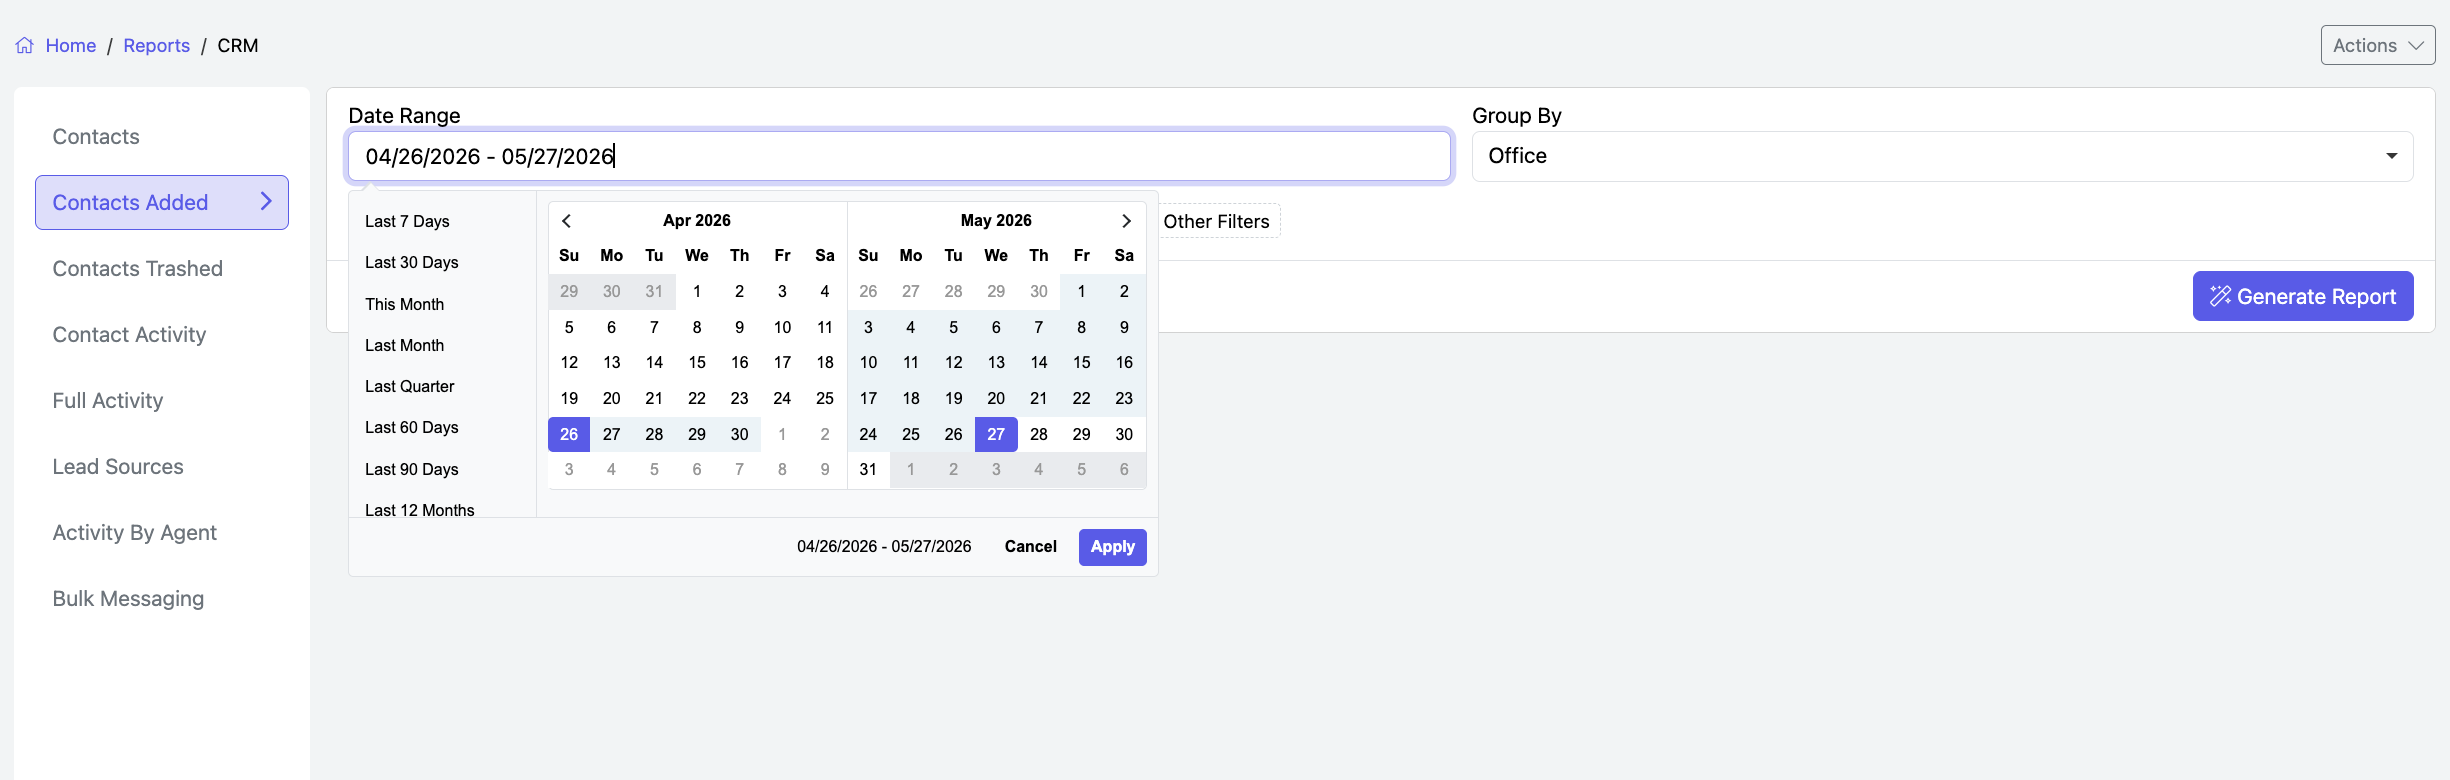
This tab allows you to run a report of the number of contacts an agent as added in a specific time frame.
- Select the Date Range.
- Use the dropdowns to filter by Lead Source and Lead Status (if applicable).
- Choose a grouping option from the dropdown menu.
- Once your parameters are set, click the blue "Generate Report" button.
CONTACTS TRASHED
This tab lets you generate a report on the number of contacts an agent has trashed within a specified time frame.
- Select the Date Range.
- Choose a grouping option from the dropdown menu.
- Once your parameters are set, click the blue "Generate Report" button.

CONTACT ACTIVITY
This tab allows you to generate a report on agent interactions with contacts in their CRM within a specific time frame.
- Select the Date Range to define the reporting period.
- Filter by activity type—choose from Phone, Note, Email, or Transaction Added. You can select one or multiple activity types at a time. By default, the report includes all activity types.
- To remove an activity type, click the “X” next to it.
- To add an activity type back, click inside the text box and select it from the dropdown menu.
- You can choose to:
- Include Trashed Contacts
- Exclude Trashed Contacts (default)
- Include Only Trashed Contacts
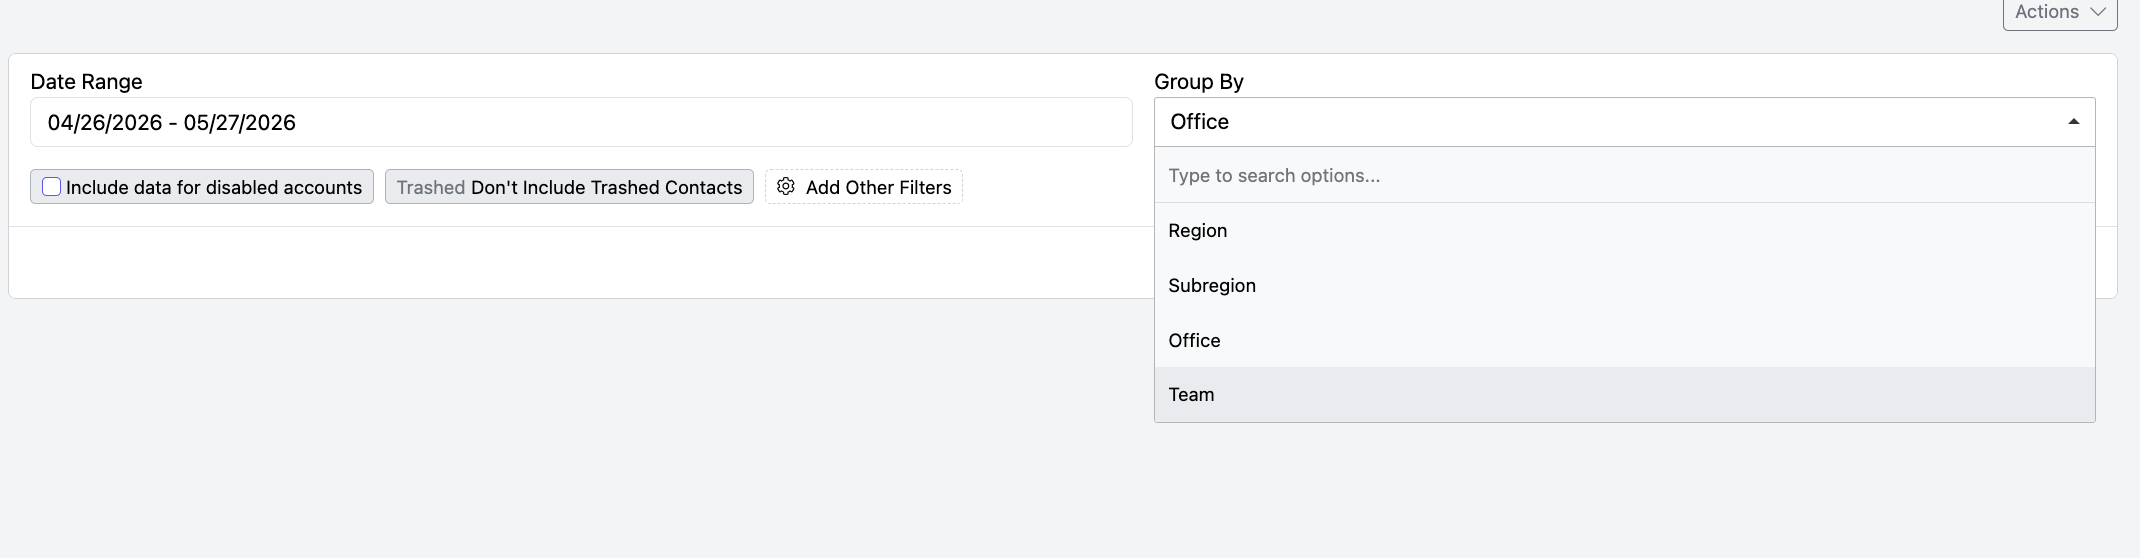
Before generating the report, you can choose to group it by Office or Team using the dropdown menu.
Hide inactive contacts by selecting the "Hide Empty Rows" checkbox.
Click the blue "Generate Report" button to run the report.

To view more detailed information about the contact's activity, select the blue “+” button before the Account name.
To minimize the detailed information, select the red “-” button.


FULL ACTIVITY
This tab generates a detailed activity report within a specific time frame, tracking interactions between an agent and their contacts in the CRM.
- Select the Date Range
- Office / Team: You may choose to filter by Office or Team
- Agent Assigned: If you are searching for contact activity for a specific agent, select or enter their name
- Activity Creator: Select the agent who created the activity, which may not be the same as the agent assigned to the contact.
- Select Activity Type – Click inside the "Activity Type" text box to choose one, multiple, or all activity types (Phone, Note, Email, Email Status, and Transaction) from the dropdown menu.
- Lead Source / Lead Status: make selections from the dropdown if applicable.
- Click "Generate Report" to run the report.
- To download the report, click the CSV button in the top-right corner.

Lead Sources: This tab generates a report on which Lead Source types have produced leads within a specific time frame.
- Select the Date Range
- Refine your search by filtering by Office, Team, or Assigned Agent.
- Click the blue "Generate Report" button to run the report.
Once generated, a pie graph will display how different Lead Sources compare. Hover over any section of the graph to view the number of leads from that source without scrolling through the report.
To download the report, click the CSV button in the top-right corner.

- Activity by Agent: This tab generates a report on activities created by specific agents.
- Select the Date Range to define the time frame.
- Refine your search by filtering Office, Team, Agent, Activity Type, Lead Source, and Lead Status.
- Choose how to aggregate the data—by month or year.
- Click the blue "Generate Report" button to run the report.
The results will display the Account Name along with the number of activities created within the selected period.

Bulk Messaging: This tab generates a report on mass emails and texts sent through the system.
- Monitor click and open rates to track the effectiveness of email campaigns (Enable this in Setup → Brokerage).
- Select the Date Range for the report.
- Choose an Account to filter by a specific user.
- Select the Message Type – Choose Email, SMS, or both.
- Filter by Status – Select Processing, Finished, or Failed.
Once your filters are set, generate the report to review messaging performance.
. 